

The Federal Debt Disaster Nobody In Washington Wants To Own
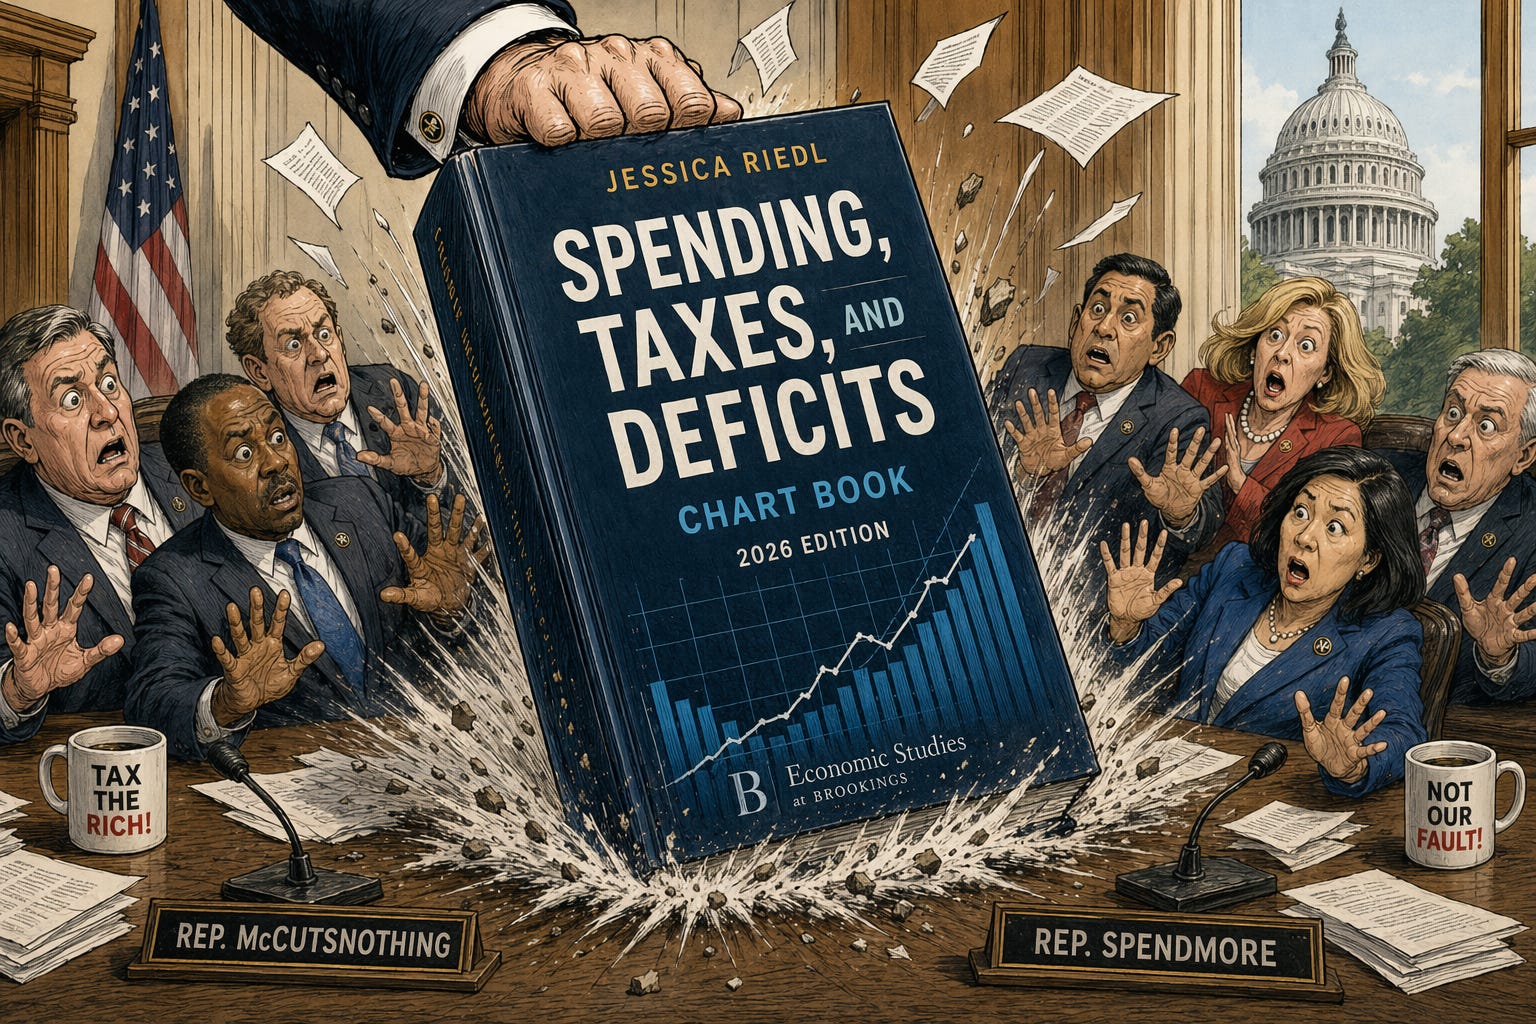
The Annual Federal Budget Chart Book - 2026 Edition - that tells the truth Washington avoids - one very, very, very large national debt, and more...

⏱️ 5 min read
The Hole Keeps Getting Deeper
Washington has many bad habits, but one of the worst is pretending the national debt is somebody else’s problem.
Republicans talk about fiscal restraint until real spending discipline becomes politically inconvenient. Democrats talk about fairness and “investment” while treating trillion-dollar deficits like background noise. Both parties campaign as though arithmetic is negotiable. It is not.
That is why Jessica Riedl’s annual chart book matters. Riedl, a budget and tax fellow at the Brookings Institution, has built a reputation for doing something too few people in Washington are willing to do: laying out the fiscal truth plainly, directly, and with receipts. The 2026 edition, Spending, Taxes, and Deficits: A Book of Charts, is another year’s worth of truth-telling about a government that keeps borrowing, deferring, and pretending the bill will never come due.
The chart book’s own highlights tell the story fast enough. It points to annual budget deficits approaching $4.4 trillion within a decade, interest consuming 31% of revenues, and Social Security and Medicare shortfalls driving the long-term red ink. This is not a marginal warning. It is a direct challenge to the excuses both parties keep making.
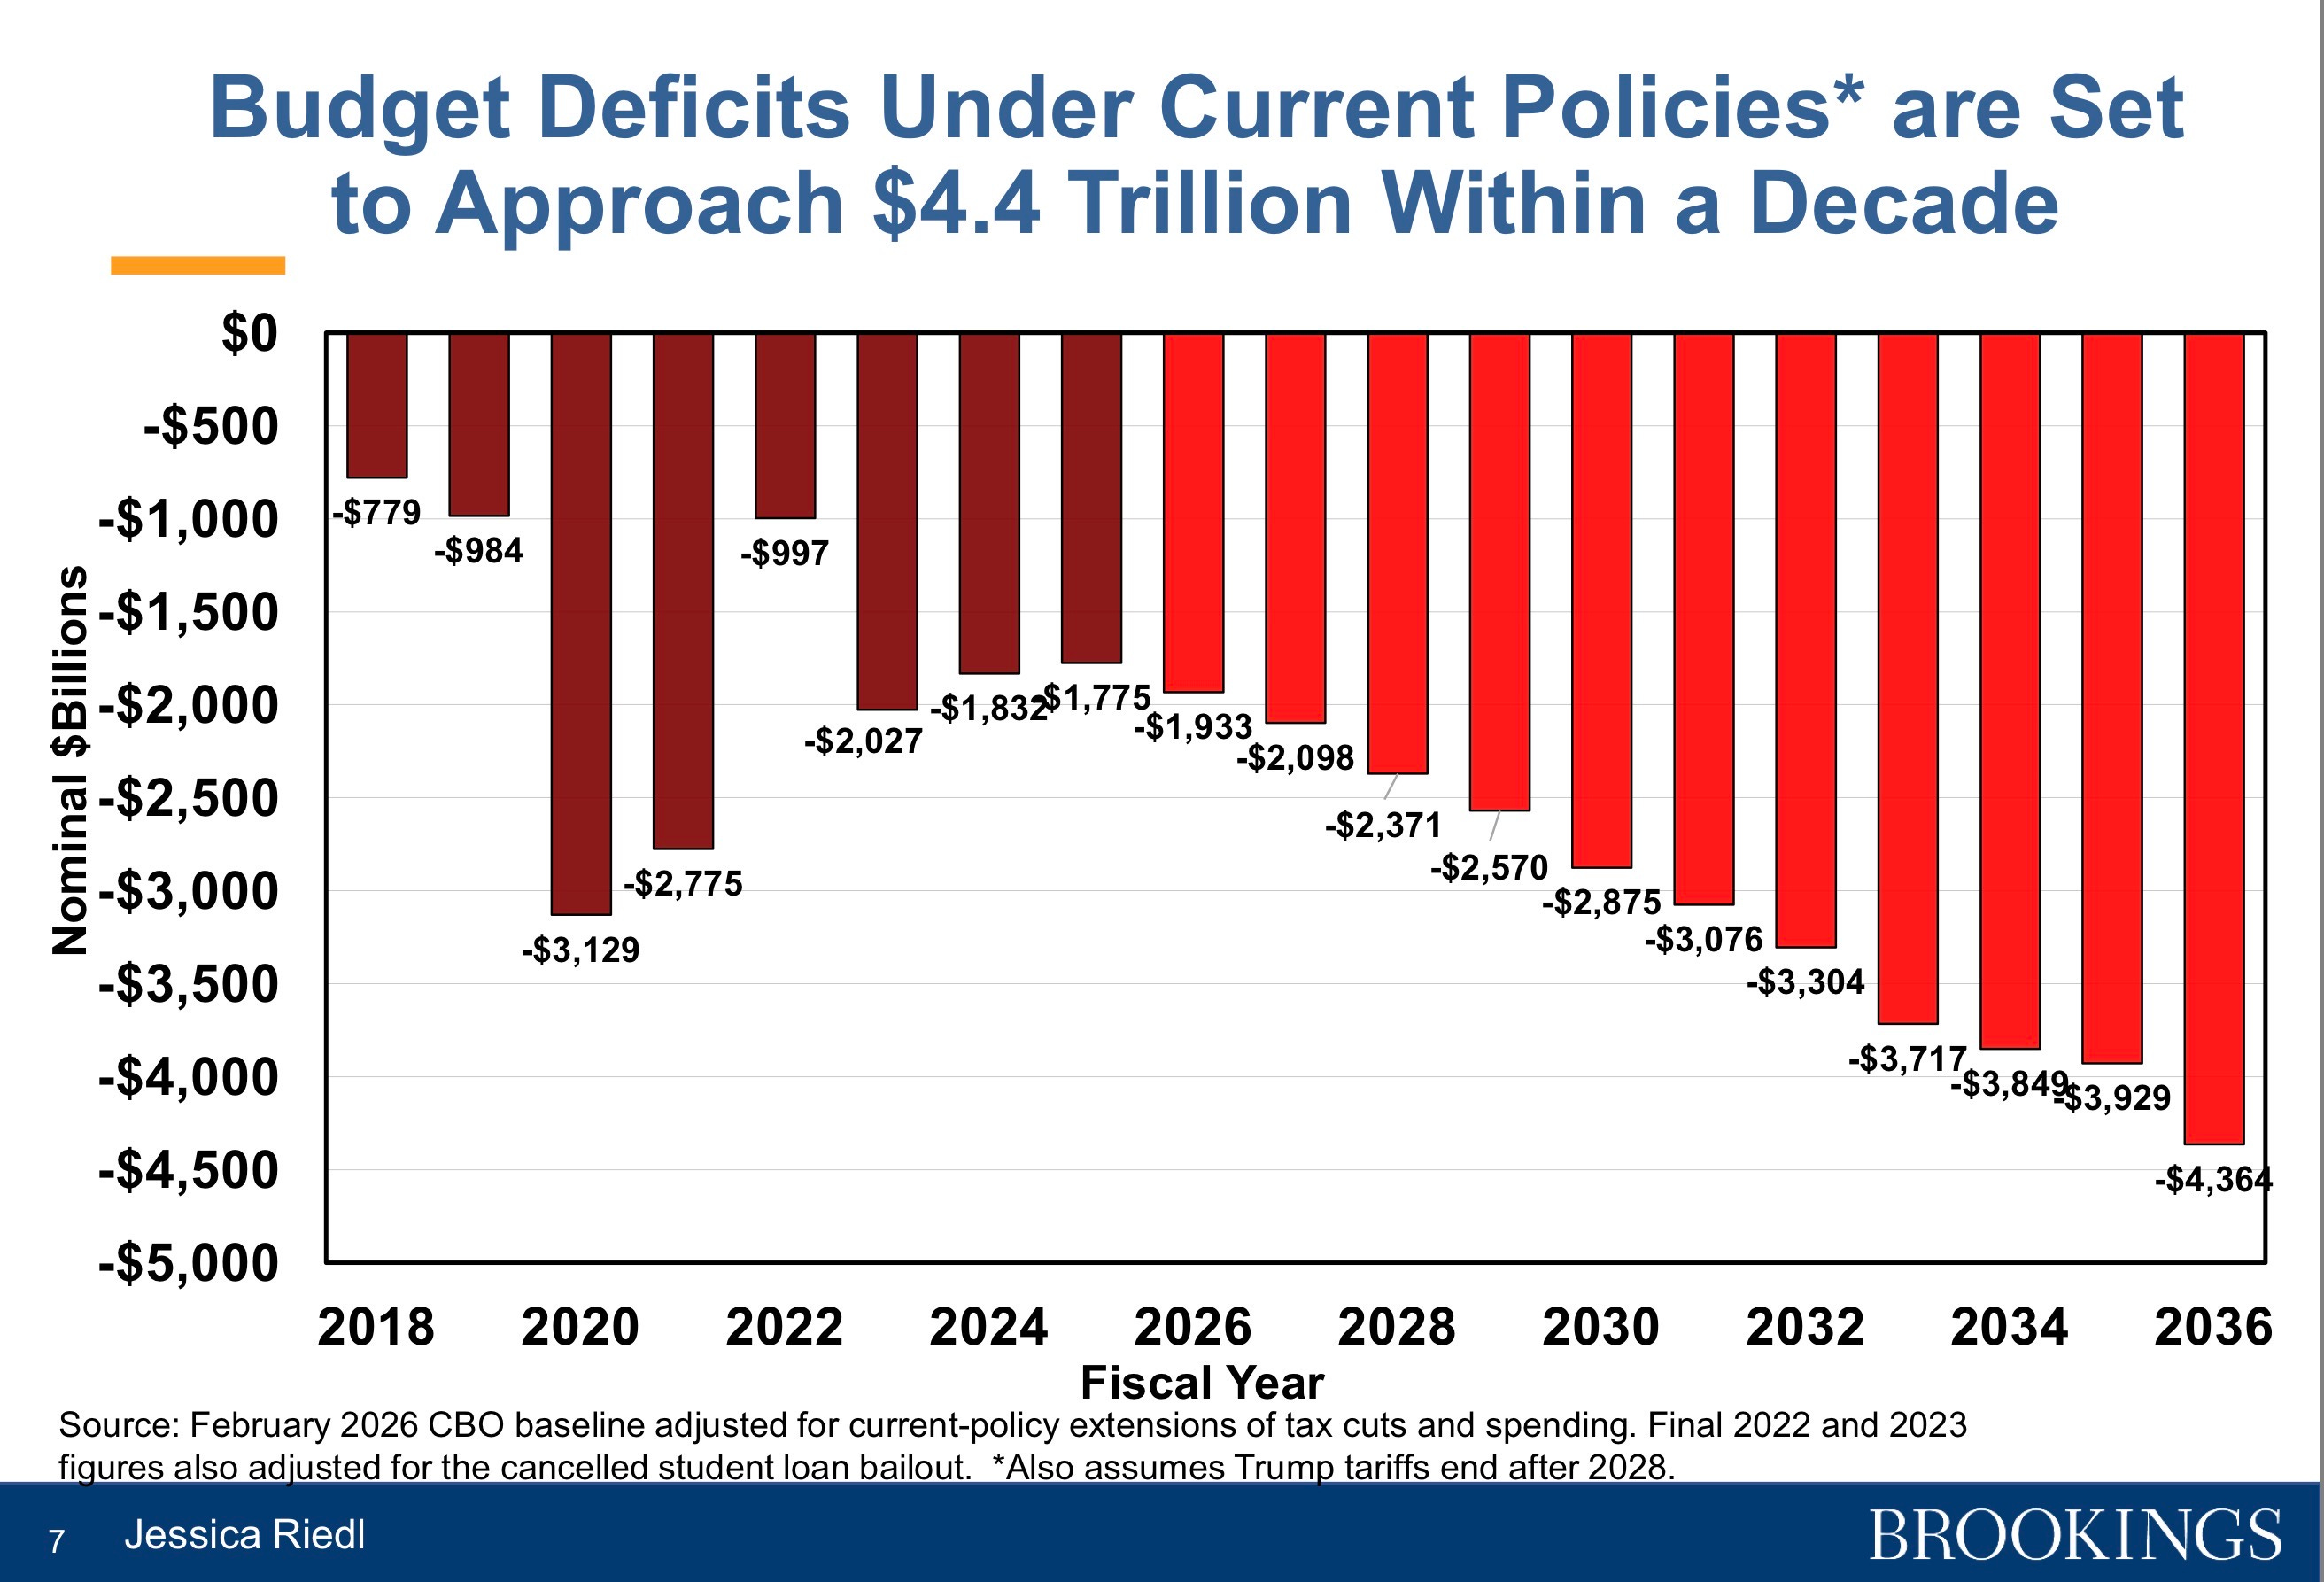
Start with the most basic point. The chart on page 7 shows deficits under current policies climbing toward $4.364 trillion by 2036. That is not a normal number, and it should not be treated like one. But Washington has grown so comfortable with trillion-dollar deficits that even projections like this barely seem to disturb the people responsible for them.
This Is A Spending Problem
One of the most dishonest habits in budget politics is acting as though the federal government’s long-term problem is simply that taxpayers are not sending enough money to Washington. That is politically convenient, but it is not what the numbers show.
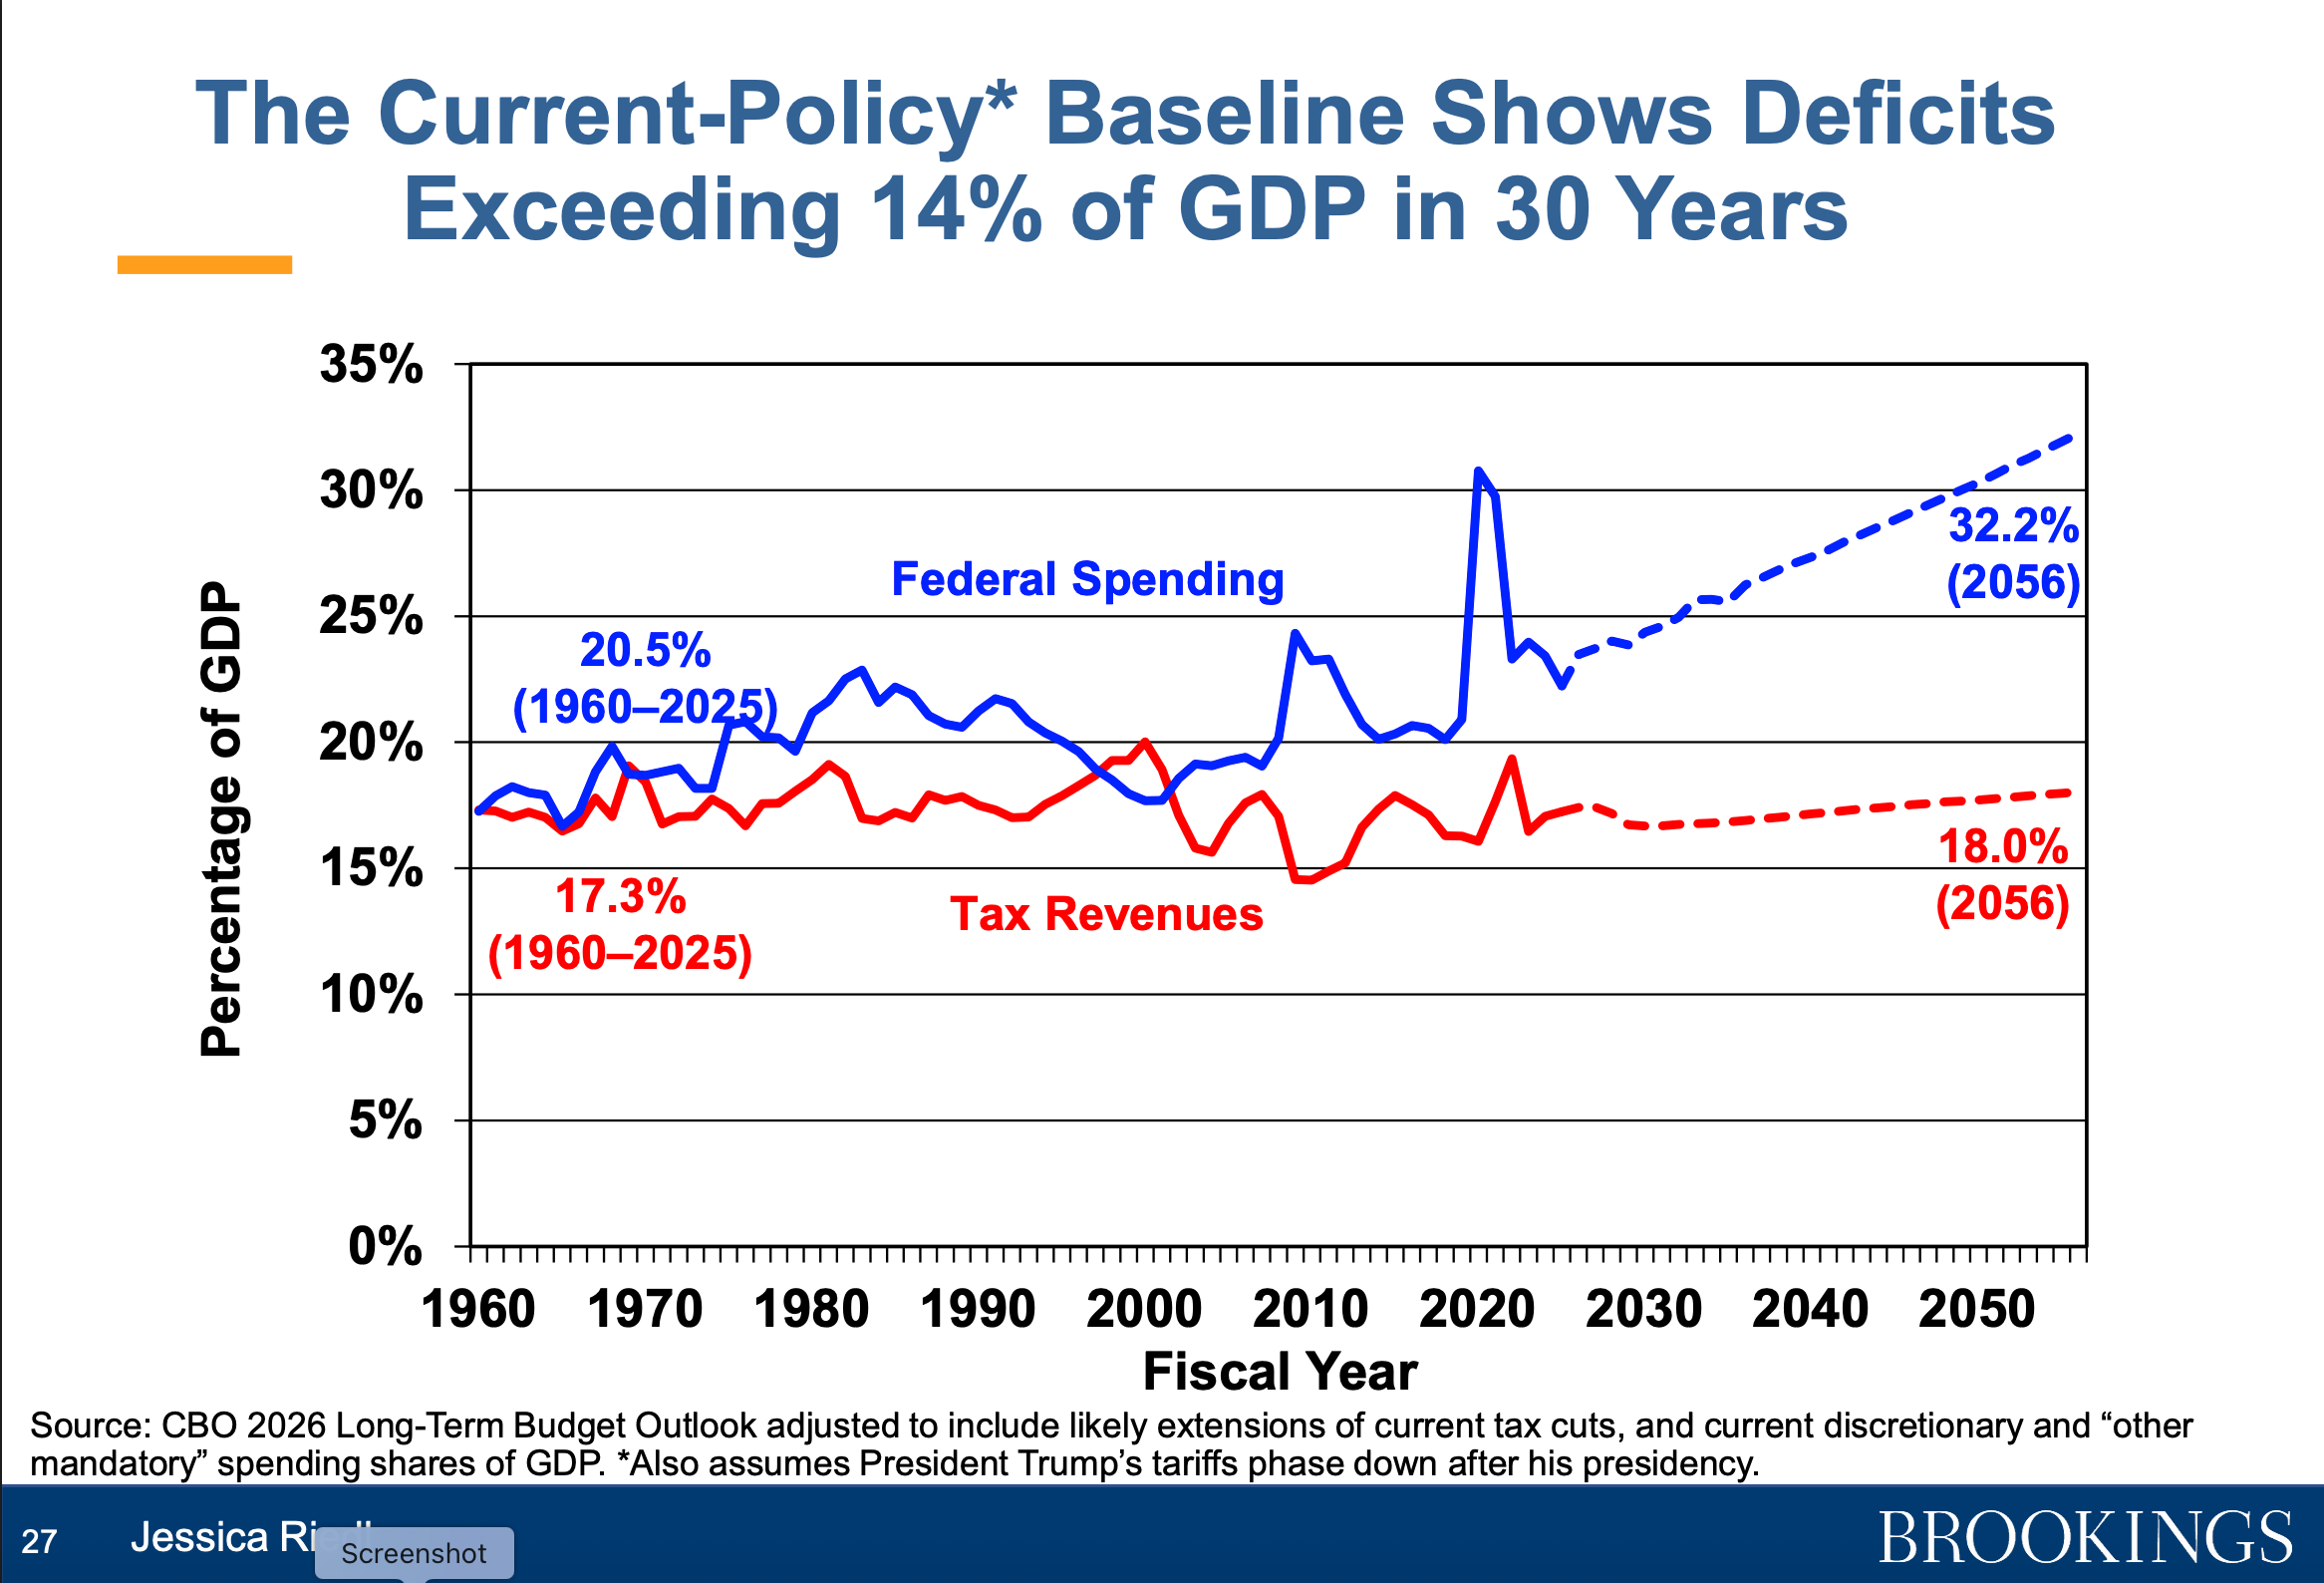
The chart on page 27 cuts right through the spin. It shows federal spending rising to 32.2% of GDP by 2056, while tax revenues also rise to 18% of GDP. In plain English, Washington is not suffering from a mysterious revenue collapse. It is committing itself to spending far beyond what even a growing stream of tax receipts can sustain.
That distinction matters because a bad diagnosis leads to bad policy. If this were mainly a revenue problem, politicians could plausibly promise that a handful of tax hikes would close the gap. But if the real problem is spending growth, then the usual slogans about taxing the rich, cutting a few unpopular programs, or chasing “waste” at the margins are not a solution. They are an evasion.
And that is where both parties keep hiding. Republicans would rather speak in vague generalities about restraint than level with voters about the scale of reform required. Democrats would rather imply that a politically satisfying tax agenda can finance promises that have grown far beyond historical norms. Neither side wants to fully admit how large the fiscal hole has become.
The Real Drivers Are Politically Untouchable
If you want to understand why Washington keeps drifting toward fiscal danger while pretending a few cosmetic cuts can fix it, the most important part of the chart book is where it identifies the actual drivers.
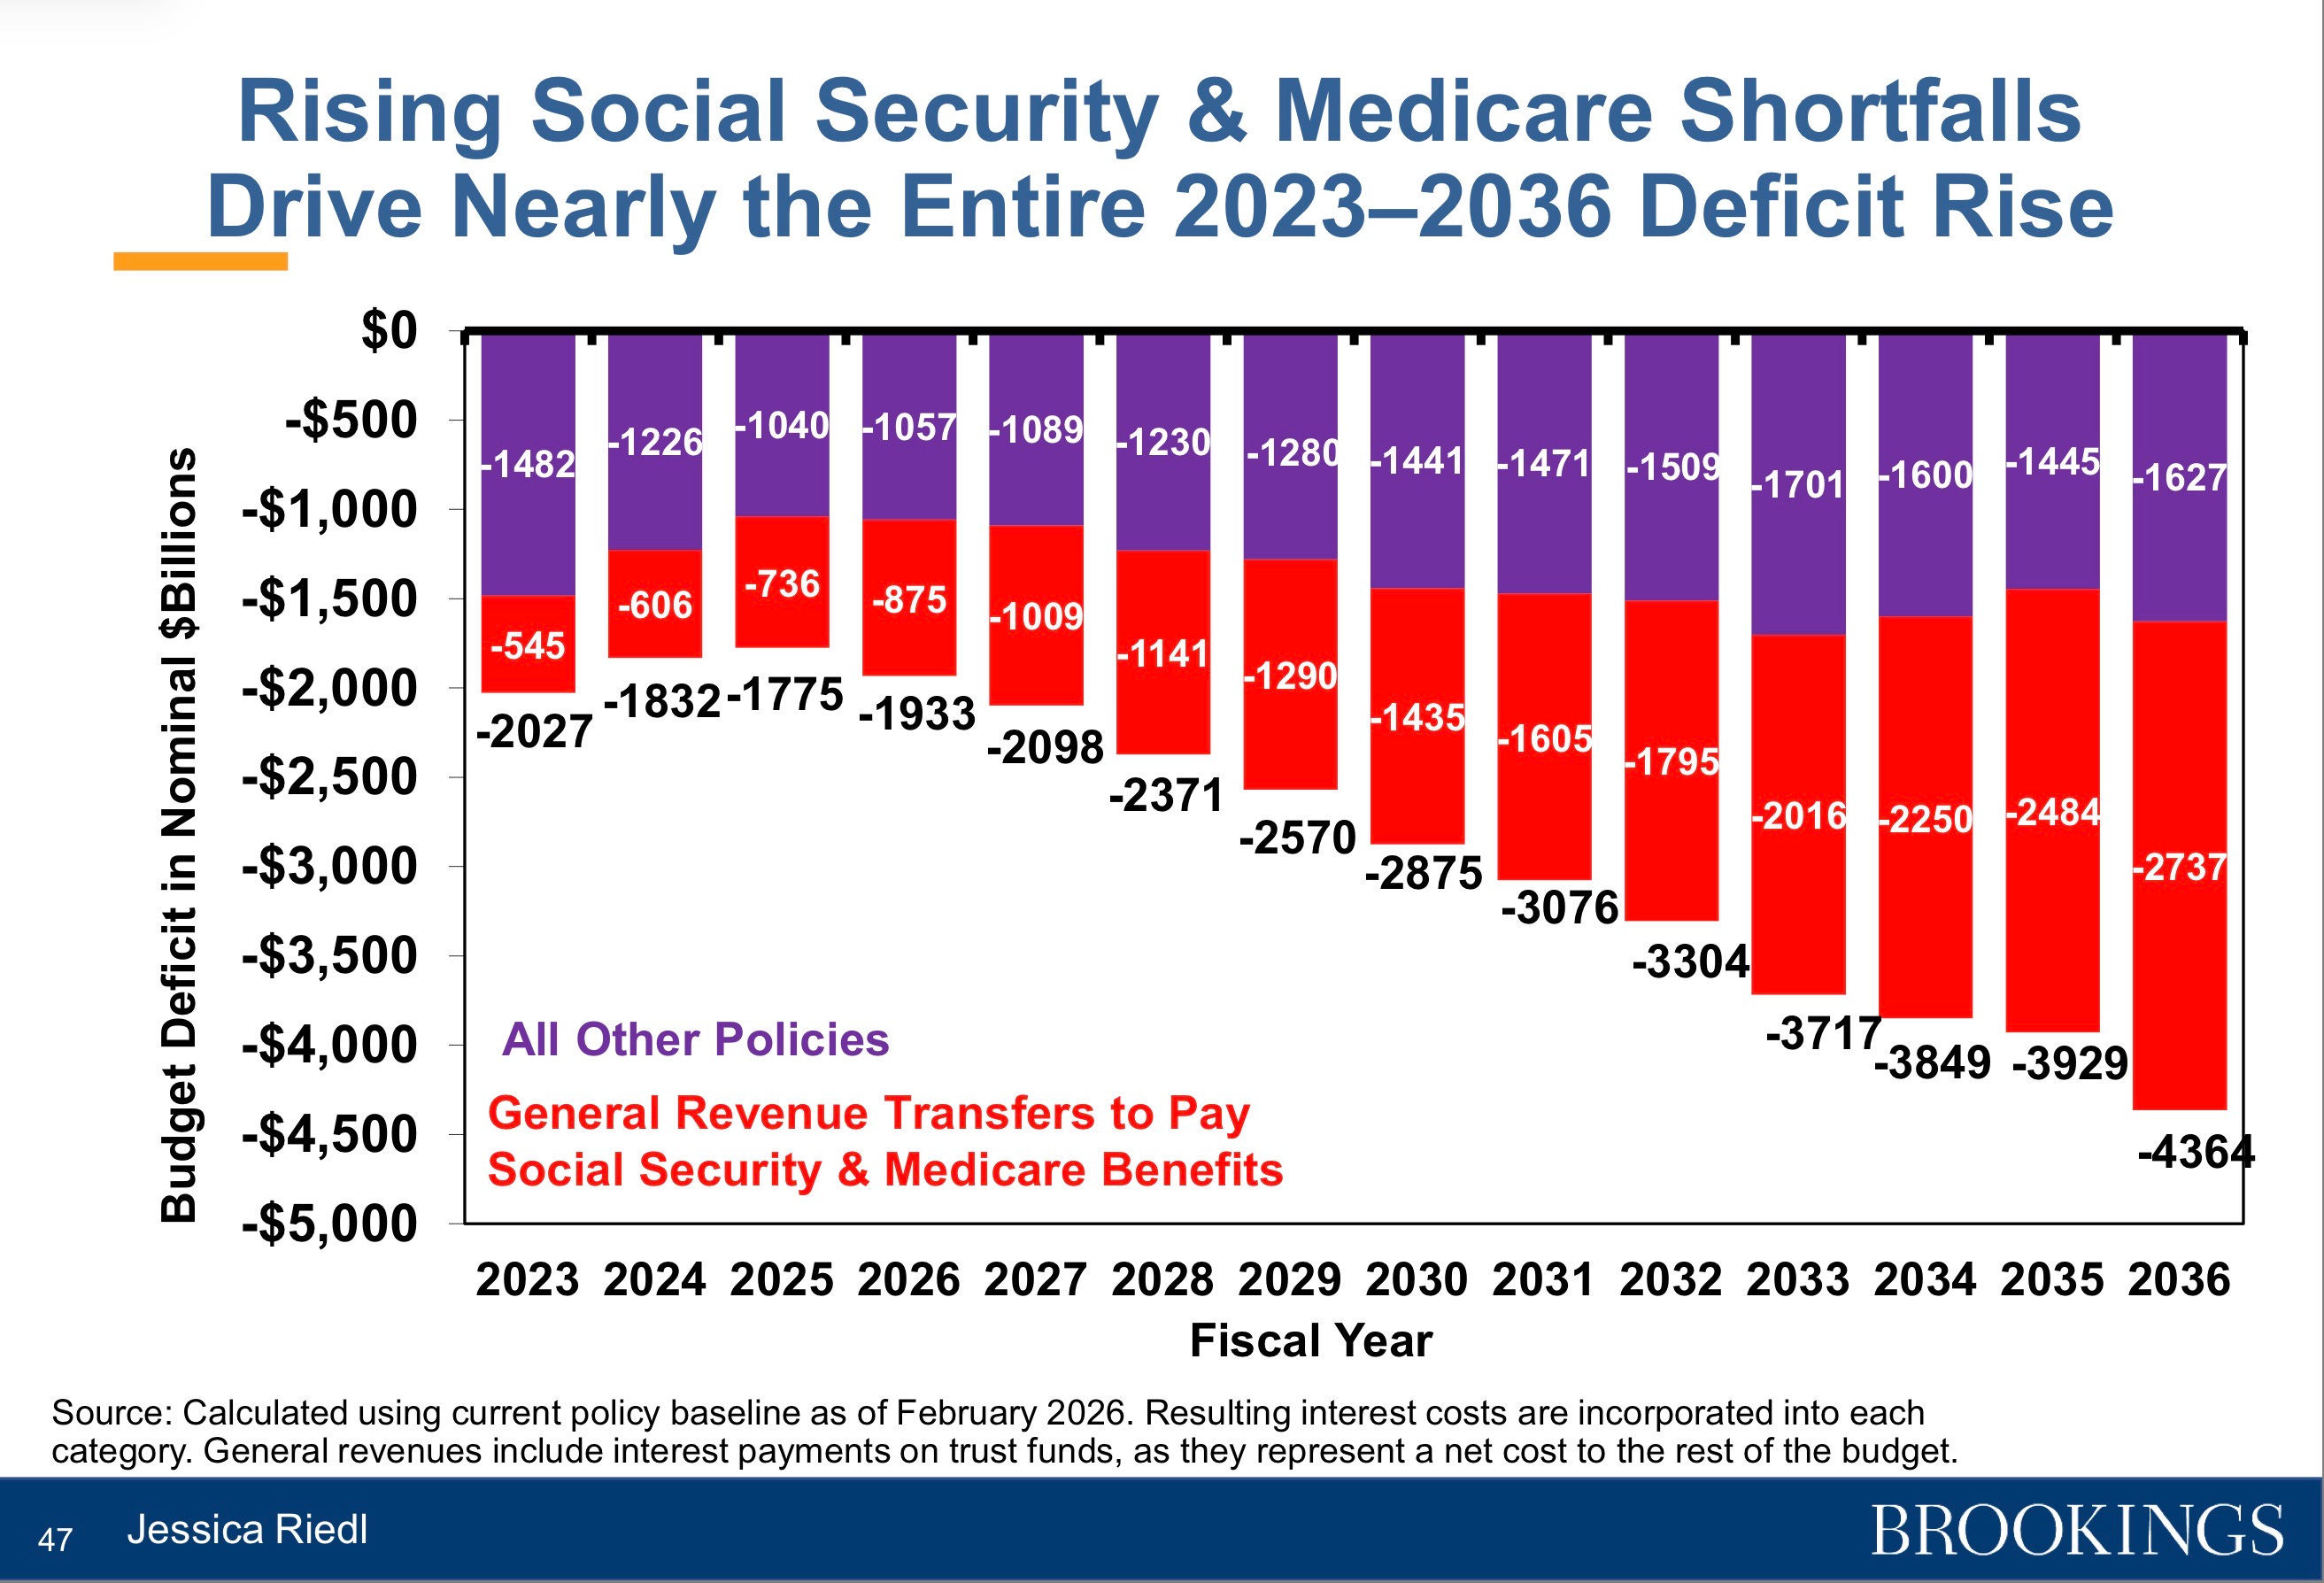
The chart on page 47 shows that the worsening deficit over that period is driven overwhelmingly by the growing cost of financing Social Security and Medicare shortfalls. That is the debate Washington hates most, because it forces elected officials to confront the parts of the budget they are most afraid to touch.
Of course, there is waste in government. Of course, there are dumb line items that deserve to be cut. But serious people should stop pretending that the long-term debt crisis lives in foreign aid, some consulting contract, or a few tiny programs politicians like to use as props. The core problem lies in the largest automatic spending commitments and the mounting interest costs from endless borrowing.
That is one reason Riedl works so hard to put out this chart book every year. This is not just another policy pamphlet. It is a running public record of the gap between what Washington says and what the numbers actually show. And year after year, that gap keeps getting wider.
So, Does It Matter?
What makes this chart book useful is that it strips away the excuses. It does not let Republicans hide behind anti-spending rhetoric while avoiding structural reform (to be fair, there are some GOPers who are deficit hawks, but not enough to matter, apparently). It does not let Democrats pretend that higher taxes on a politically convenient slice of earners will magically stabilize the debt. It leaves both parties exposed.
If Washington were serious, a chart book like this would be treated as a call to action. Instead, it is more likely to be treated as an inconvenience, because it refuses to flatter either party’s preferred myths. It shows the country drifting deeper into debt, deeper into interest costs, and deeper into a fiscal trap that gets harder to escape with every passing year.
Before I finish, I really do need to praise Jessica here. Until you actually go through the document, you cannot really appreciate its depth and thoroughness. While a sobering read, it is necessary.
If you are tired of budget spin, read it. If you want to understand why the debt keeps climbing no matter who wins elections, read it. If you want to see your Member of Congress squirm, bring them this booklet and ask them what they are doing about it. And watch them try to blame anyone and everyone except themselves.
Three Charts Above, Three More Below The Paywall
The three charts above show the scale of the deficit problem, the real spending driver behind it, and the politically protected programs making it worse. Below the paywall, curated for paid subscribers, I have included three more charts on interest costs, taxes, and the limits of Washington’s usual excuses.
And if this issue matters to you, spend time with the full chart book. It is worth it.
